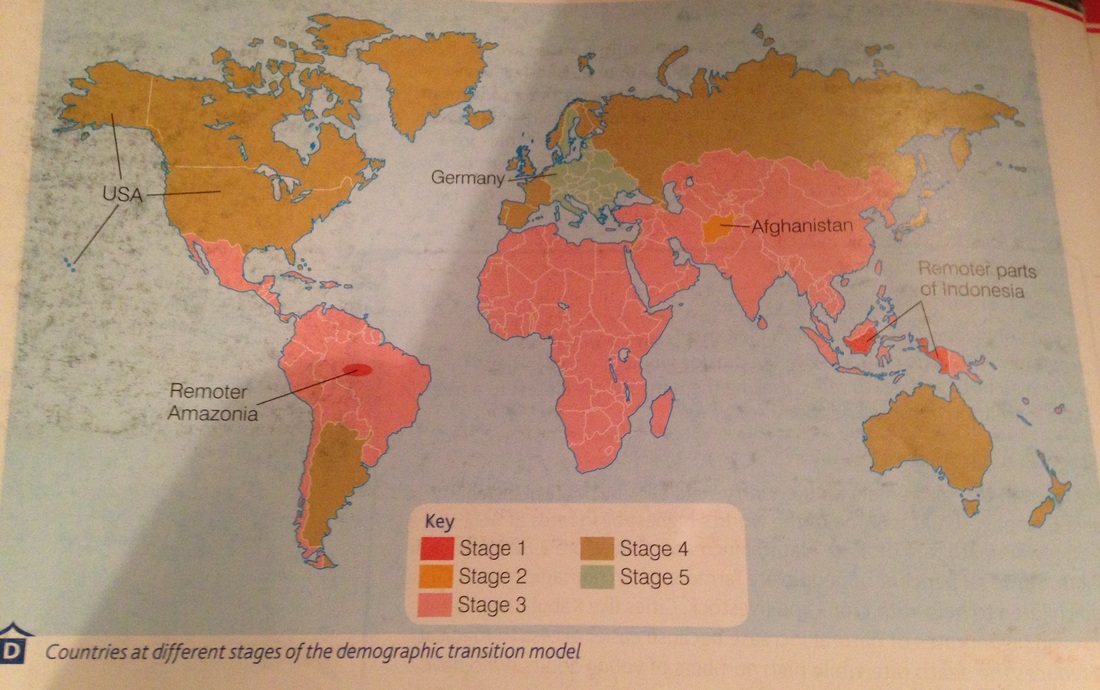
The Demographic Transition Model (DTM) explains patterns of birth and death rates across the world and through time. Stage 5 of the model was added later due to more recent changes in Europe.
Stage 1 is the least developed, Stage 5 is the most developed.
Stage 1 is the least developed, Stage 5 is the most developed.
Characteristics of Each Stage
Stage 1:
Stage 2:
Stage 3:
Stage 4:
Stage 5:
- High birth rate
- High death rate
- Both fluctuate because of disease, famine and war.
- Population fairly stable.
- Little medicine, low life expectancy and no birth control.
- Only happens today in remote areas of Amazonia and Indonesia - traditional societies largely cut off from the world.
- UK was at Stage 1 pre-1760.
Stage 2:
- Death rate decreases - key factor - improvements in medicine and hygiene cure and prevent diseases.
- Life expectancy increases.
- Birth rate remains high - may slightly increase as less mothers die in childbirth, so can have more children.
- Population grows
- On the graph, the further apart the lines are, the greater the rate of growth.
- Mainly agricultural economies, children needed to work on the land, which keeps birth rate high.
- Afghanistan today.
- UK 1760-1880
Stage 3:
- Death rate falls more slowly
- Birth rate drops rapidly - due to available birth control and economic changes - beneficial to have a small family - kids cost as they have to go to school so can't work
- Population still grows, but not as fast
- Brazil, India, Kenya etc. today
- UK 1880-1940
Stage 4:
- Low birth rate
- Low death rate
- Birth rate tends to fluctuate depending on economic situation - jobs and earning a good living make people more likely to have children - unemployment and low wages people postpone having a family until later
- Overall slow population growth
- UK, USA, France etc. now!
- Countries at Stage 4 are the most sustainable.
Stage 5:
- Very low birth rate, goes below the death rate
- Death rate has increased slightly due to ageing population
- Total population begins to decrease
- Many eastern countries like Lithuania (uncertain economy) and some western (women with careers) countries like Germany at this Stage.
Specific Examples
Stage 1: Traditional Rainforest Tribes
The closest situation to true stage one is in parts of Indonesia, Brazil and Ecuador, where small numbers of people live with little contact to the outside world.
Stage 2: Afghanistan
Afghanistan is very poor, held back by political instability. It has one of the highest birth rates of 46.2 and a death rate of 20.0 - so a natural increase of 2.62. About 79% are farmers, often nomadic, so need children to help with crops and livestock. Cities like Kabul (capital) have higher rates of NI because there is easier access to medical care, while young adults migrating to the city increase the birth rate.
Stage 3: Brazil
Although at Stage 3, Brazil is an NIC, so developing fast economically. The population almost doubled (108 to 208 million people) between 1975 and 2015. It's Roman Catholic, so has a high birth rate, but improving standards of living mean that people are seeing the benefits of fewer children.
Stage 4: USA
The USA has the largest and most developed economy in the world, and the 3rd largest population - 326 million people in 2017, and it has high growth for its Stage is due to immigration. Many immigrants come from Catholic Central America, but the USA is now encouraging a highly trained Asian workforce, who are likely to have lower birth rates.
Stage 5: Germany
Almost as well developed as the USA, but at a different stage as women are achieving high-powered positions at work, and there is an ageing population. The birth rate is well below replacement rate, so the government has to cope with a large elderly population and a declining workforce.
Problems with the Demographic Transition Model
- Eurocentric, based on how European countries progressed.
- Does not include impacts of migration
- Doesn't give a timescale
